


The ‘Swan Effect’ is one of the most well-known metaphors in business; the bird gliding gracefully on the water… but paddling like crazy beneath. We all recognise the illusion. But how many of us recognise the same potential for illusion when it comes to analysing our customer data? We should keep it in mind. Because sometimes – just like the swan – what we see on the surface tells a different story to the undercurrents frantically bubbling below. If we want to glide gracefully to commercial success, we need to understand both.
To demonstrate the point, let’s zoom in on a random set of customers – EU4+UK pulmologists – and explore medical channel preference trends in 2019 and 2020. Our analysis is based on Navigator365™ Core research which – exceptionally – was conducted in two waves in 2020 (Q2/3 and late Q4) to help customers track key changes throughout the year.
One of the most popular charts highlights HCPs’ communication preferences for medical engagement with biopharma*.
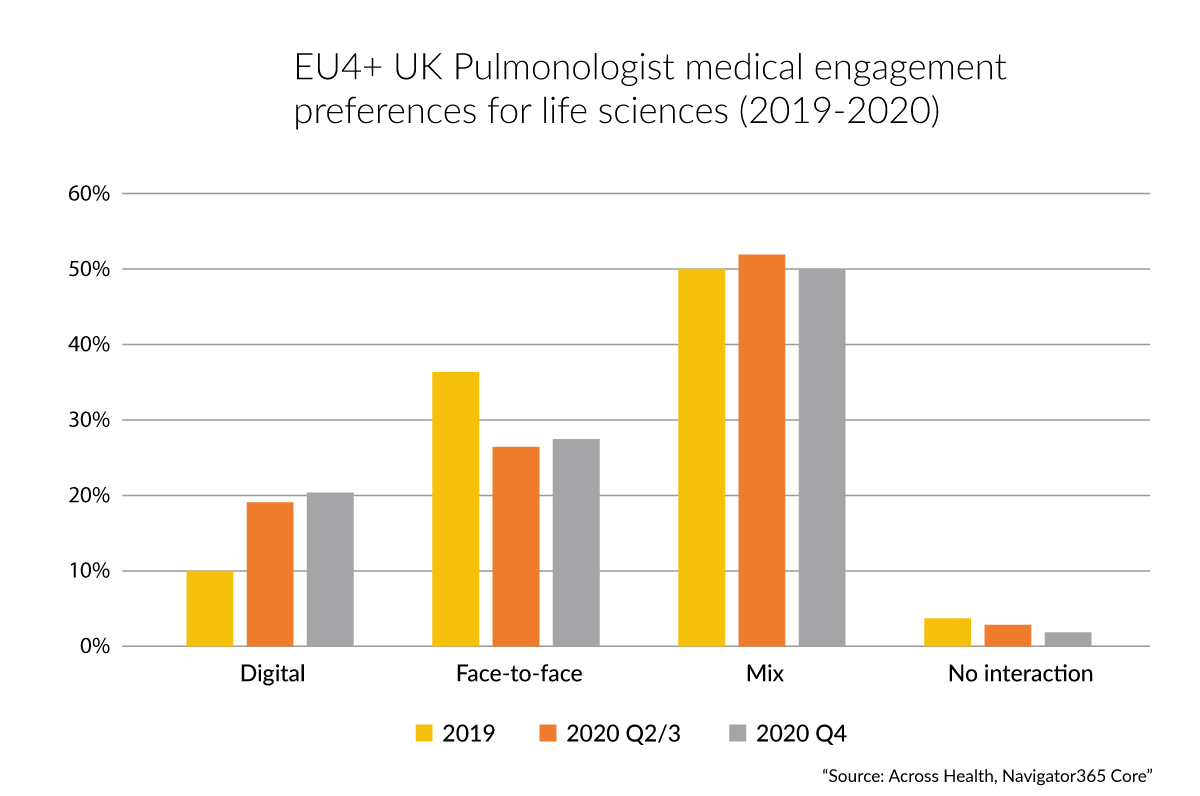
At first glance, one would conclude that:
- Between 2019 and 2020, pulmonologists’ preference for F2F medical engagements dropped but their appetite for digital engagement increased. And, at the end of 2020, mix + digital covered 70% of respondents’ preferences for medical engagements;
- Nothing much changed in the final 4-5 months of 2020.
But could this “flatliner” average in latter months of 2020 conceal any deeper dynamics at the customer level? Such sophisticated analyses can be made with the Navigator365™ Core database, where we can track (anonymized) individual respondents over time (cohorts). The Sankey diagram shows the evolutions quite visually:
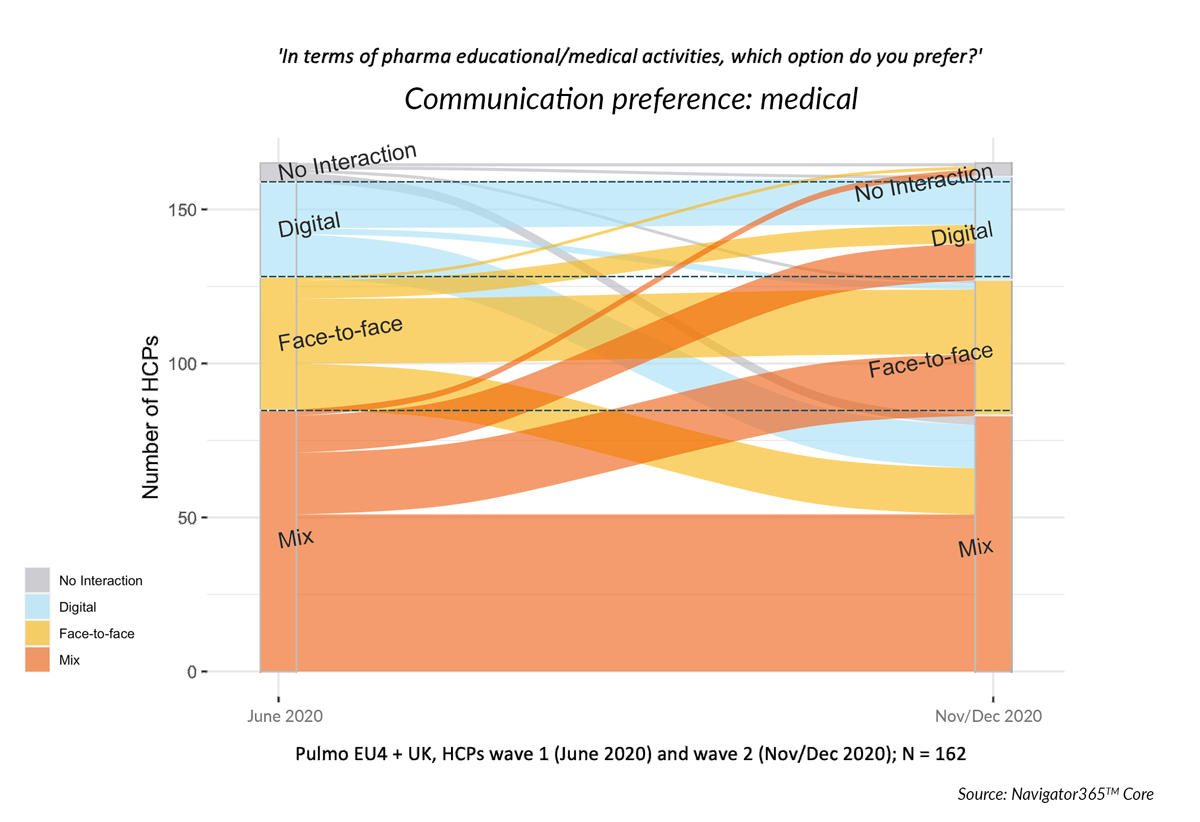
The stable picture seen in the topline averages on chart 1 has completely disappeared at the individual HCP level. In fact, far from just minimal changes, the underlying dynamics are significant:
- Only 50% with a F2F preference for medical in June continued to prefer F2F in November; 35% of this group now wants a mix, and 4% even digital-only
- The major influx to the November F2F group comes from the Mix segment, with 23% of the June Mix group preferring F2F in December (and now 8% going to digital-only).
This is a great example of the Swan Effect in play, with the topline averages simply creating an optical illusion…
- On the one hand, a segment of HCPs with a traditionally strong preference for a digital component (digital/mix) moved to F2F. This may well be due to the desire for physical engagement after almost 9 months in the C19 crisis.
- On the other, the shift of about 40% of the traditional F2F group to digital/mix may be due to the need for “plan B” access to information, since the F2F channel was semi-closed.
Customer-level channel preference dynamics … and the future of medical engagement
So could these underlying dynamics tell us anything else about the future? Quite possibly. When traditional F2F medical engagements will once again be possible, we expect the mix/digital “defectors to F2F” to want to see their colleagues in person again. But how long will this last, knowing that they had a bias for digital/mix pre-C19?
Conversely, can we imagine that the F2F “defectors to mix/digital” did so because they were forced to stay on top of the latest and greatest in their therapeutic domain – and that their digital experience was so positive that they don’t intend to go back to F2F-only, but stay at least in the “mix” group?
If the above assumptions are correct – and current trajectories continue – we could end up with a dramatically different ‘New Normal’ distribution as soon as early 2022 – with “F2F-only” dropping to a mere 13%, digital-only reaching 30% and digital+mix 84%!
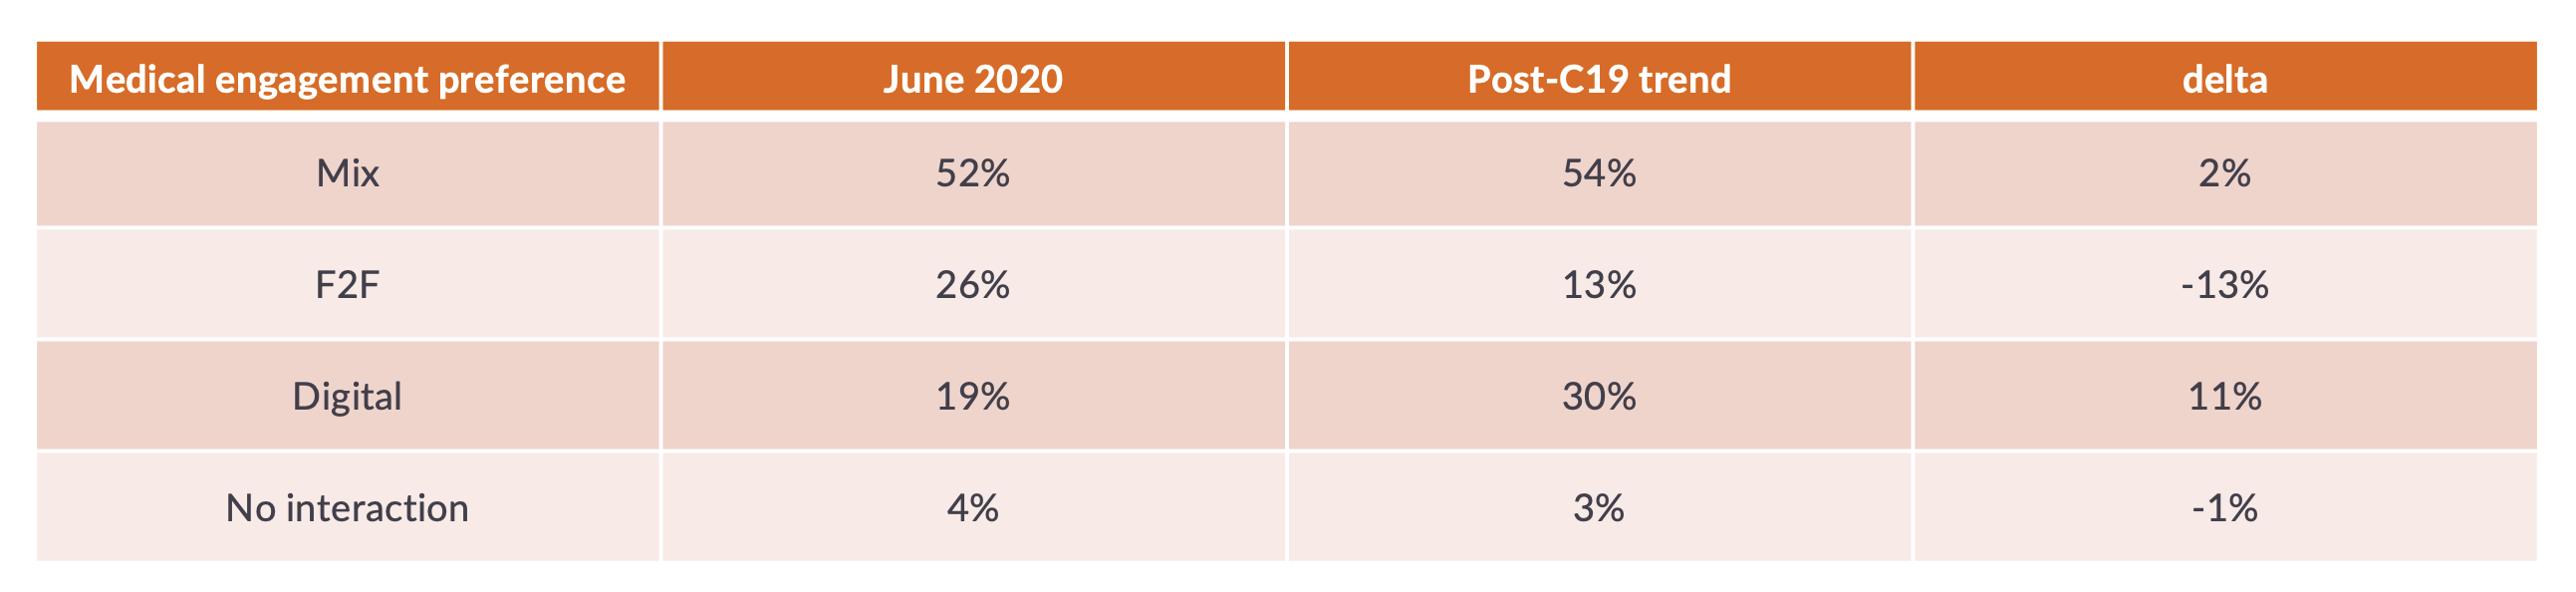
Such underlying dynamics could have more far-reaching implications for the Medical go-to-market model than many are currently thinking: a much stronger acceleration may be just around the corner.
Do we see similar trends in Commercial? In other geographic & therapeutic markets? Are there demographic/attitudinal commonalities in the shifting segments? If customers prefer channel A, what is their next-best channel and content? …We would be delighted to further explore such key questions with Navigator365™ Core clients and help you design an evidence-based future-proof go-to-market model!
In summary, recognising the ‘Swan Effect’ in your data is crucial; the top-line view is essential, but what’s going on beneath the surface is just as important. You need to get a picture of both.
* Our Navigator365™ Core Timetrends Powertool lets you compare many more of the key evolutions between 2019 and 2020 with a click of a button.