
Chart of the Month – What’s pharma’s level of interest in AI?
March 2024, our CHART of the MONTH:
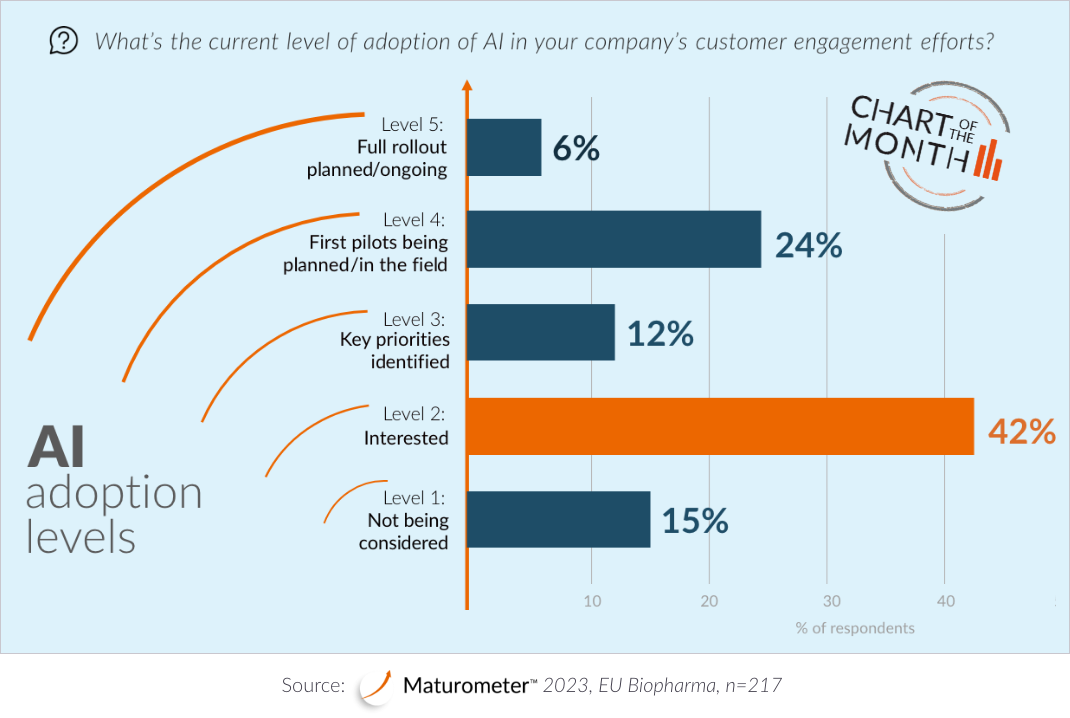
When asked “What’s the current level of adoption of artificial intelligence (AI) in your company’s customer engagement efforts?” only 15% of European biopharma respondents reported no interest at all in AI in their organization. In fact, the data show a strong inclination to incorporate AI in customer engagement efforts – though so far just under a third have progressed beyond the “interested” stage to pilots and beyond.
Of these 30%, only 6% state that their AI initiatives are fully underway, with the remaining 24% having pilots either already in the field or still in the planning stage.
There are many applications in which AI could play a role for pharma and some initial use cases can already be identified (for example, increasing productivity and efficiency in some content and creative generation). However, implementing AI in the context of mining customer-level data for more targeted engagement will require access to high-quality, well-structured and relevant data to begin with – this is something many companies still need to work on.
What’s more, many CRM environments are still very much siloed between marketing and medical – preventing the realisation of one single customer truth – or fail to capture customer data (both quantitative and qualitative) across all channels.
So while there may be potential opportunities related to AI, pharma needs to be wary of the “shiny object syndrome” and should aim to find the appropriate balance between adding new technologies and further progressing their digital capabilities and foundations.
For more insights into the latest omnichannel trends in biopharma customer engagement, download your free copy of our latest Global Trends Report.
If you would like to know more about how Navigator365™ HCP-level data could help you accelerate or optimize your AI programme, then please get in touch!
Chart of the Month is an ongoing series where we highlight an interesting chart or statistic from our Navigator365™ Core and Maturometer™ research, and offer a brief commentary on what this can tell us about trends in customer engagement in the life sciences. Browse through our previous Charts of the Month here!